 |
Science and Policy Dialogue on Designing Effective Indicators of Sustainable Development" May 6 - 9 1999, San Jose Costa Rica |
|
|
|
Summary |
|
The Science and Policy Dialogue on Designing Effective Indicators for Sustainable Development took place in San Rafael de Heredia, Costa Rica from 7 to 9 May 1999. The workshop was organized by the International Institute for Sustainable Development (IISD) and co-sponsored by the Bellagio Forum for Sustainable Development, the Deutsche Umweltstiftung, the Mistra Foundation and Deutsche Bank. The Dialogue brought together 40 participants from different geographical regions and backgrounds, including policy-makers, experts on various types of indicators, academics, and representatives from multilateral organizations and businesses. The Dialogue met in three Plenary sessions and four working groups that discussed case studies on: Community Level Sustainability Assessment in India; the European Environmental Pressure Indices Project; the work of Canada's Commissioner of the Environment and Sustainable Development; and corporate reporting of The Placer Dome Group. Keynote speakers presented each case study. Working group outcomes were subsequently considered by Plenary round-table discussions. Two break-out groups were tasked with synthesizing discussions on feeding back into decision-making processes and grouping indicators under clusters or themes. |
Photo highlights from the workshop
|
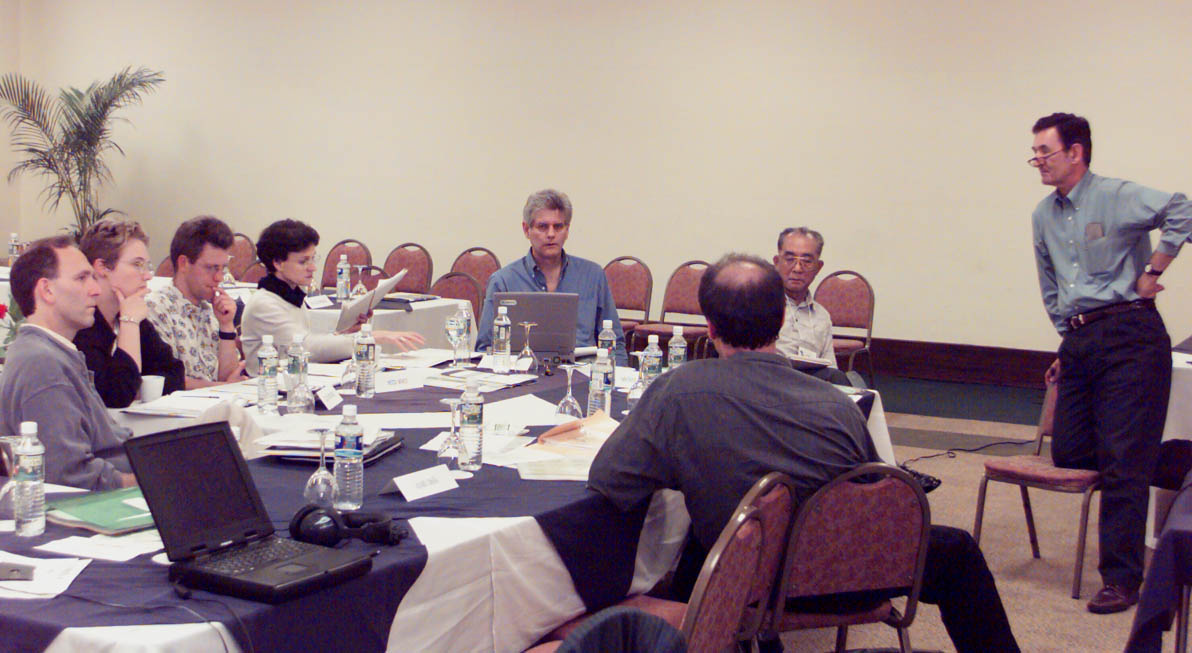
Working Group 1, which met to discuss the European Environmental
Pressure Indices Project during the workshop. Participants also discussed
the clustering methodology used by the United Nations Commission on
Sustainable Development, following Agenda 21's main chapters.
|
|
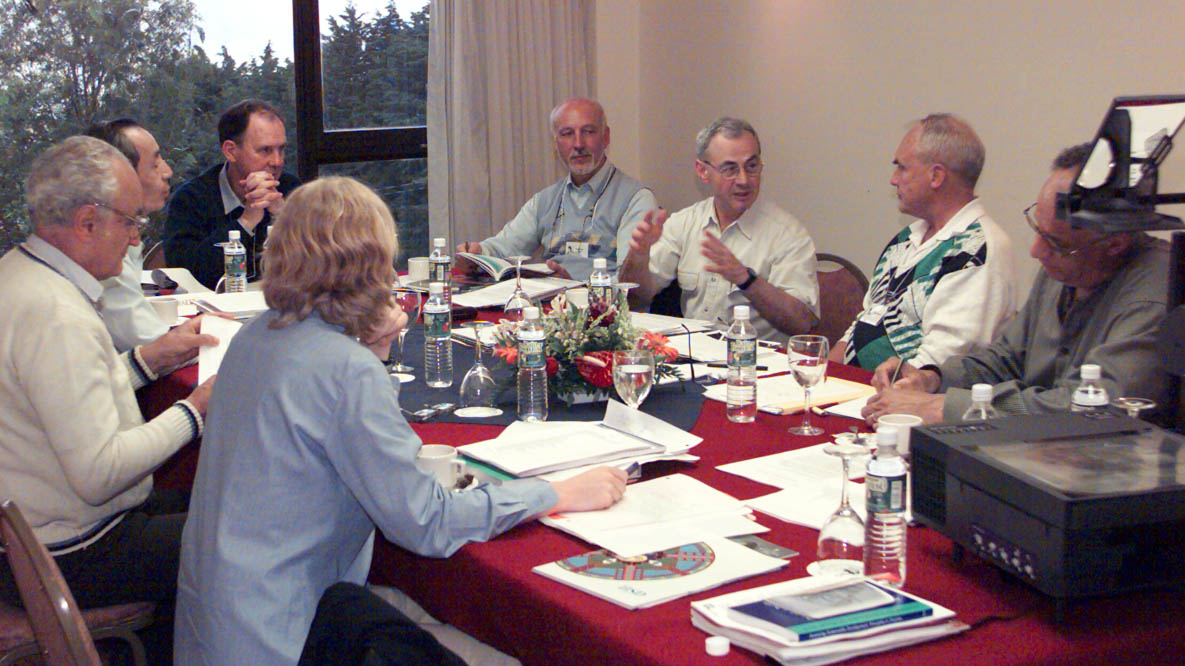 |
Working Group 2
used the work of Canada's Commissioner of the Environment and Sustainable
Development as their case study. The
group designed a diagram to illustrate a sustainable development reporting
system. The system builds on a process that includes both indicator
development and assessment, leading to the production of a sustainable
development report. |
|
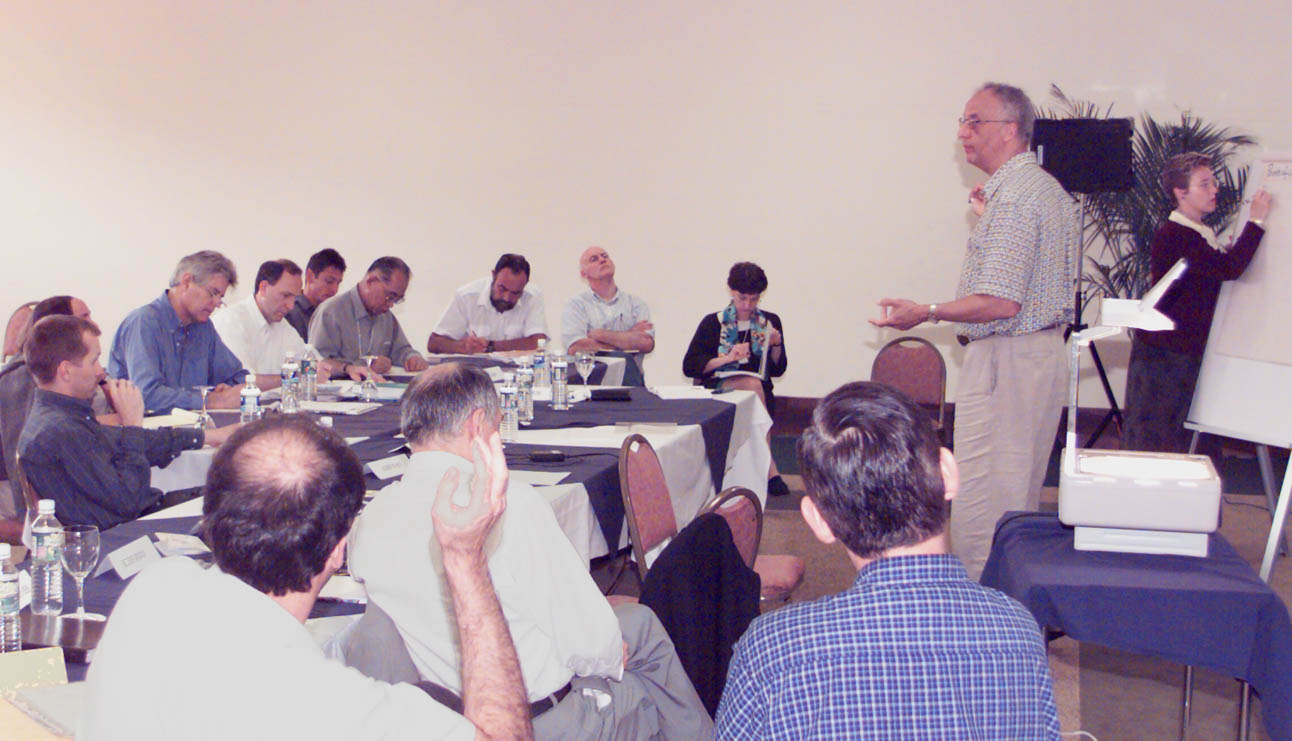
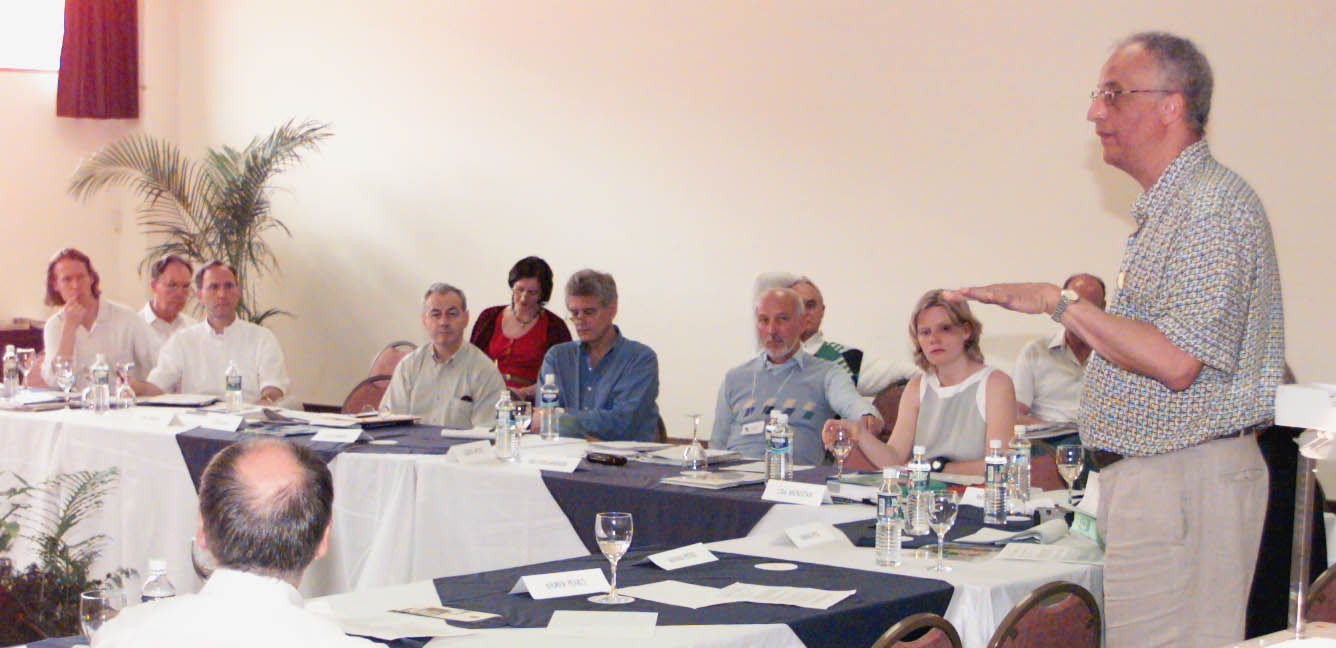
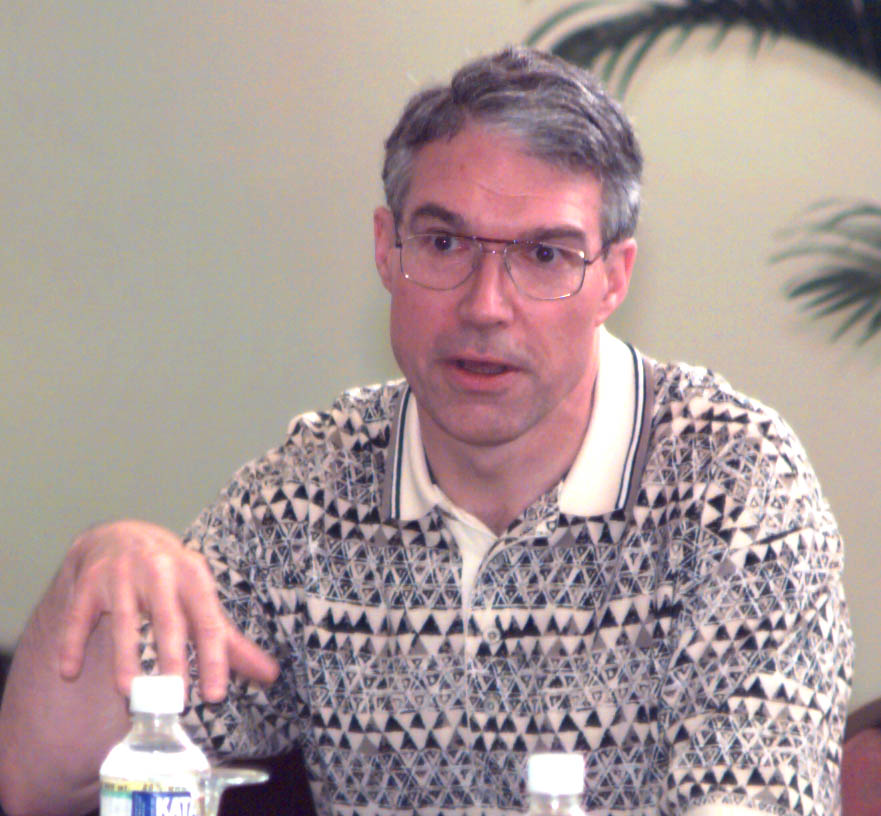
Adil
Najam, Center for Energy and Environmental Studies (middle, back row),
opened Working Group 3 with a presentation entitled Community Level
Sustainability Assessment in Dasudi, India, a participatory assessment
method developed by IUCN and IDCR and tested in India. He explained
that the approach combined institutional, project and whole system assessment.
Najam referred to a holistic and systemic approach to assess community
level sustainability.
|

|
 |
Tony Hodge, IISD, presented the "Placer Dome Group" case study to Working Group 4. He said the challenges that the Group faces are parallel to those faced by broader society with respect to the need to address environmental, economic and social concerns. Hodge noted that the Group annually compiles a small set of well understood financial indicators and no equivalent set exists to track human and ecological concerns. He said the Group had not attempted to compile aggregated indices to address the various dimensions of sustainability. |
|
Synthesis
Discussions on "Process:" This breakout group, facilitated by David
Bell, sought to synthesize discussions on approaches to clustering indicators
and on sustainable development assessment and reporting processes. Several
participants agreed that the ultimate purpose of reporting on performance
was to improve decision-making and to contribute to bending the curve
of development in the direction of sustainability. Participants agreed
to focus their discussion on principles underlying assessment and reporting
processes.
|
|
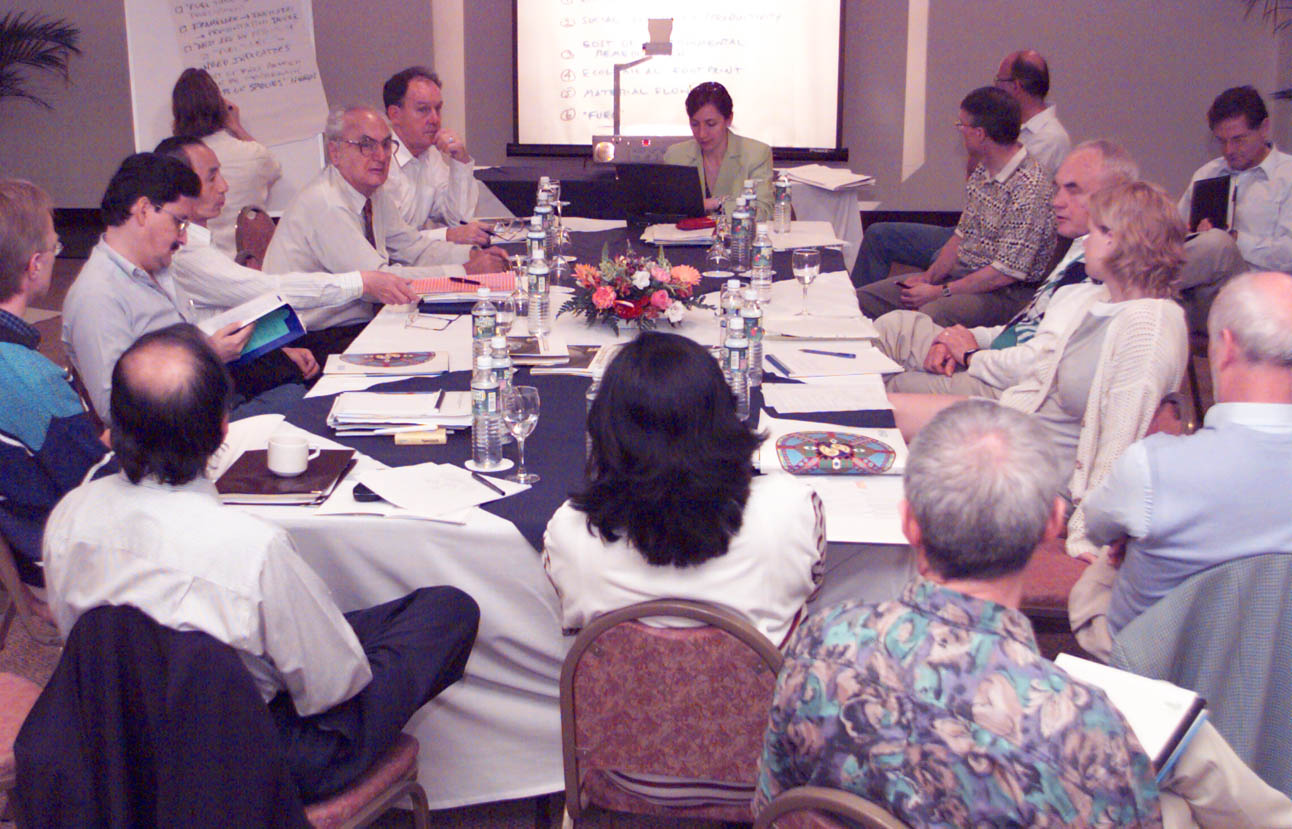 |
Synthesis Breakout Group on "Clusters:" The breakout group, facilitated by Richard Norgaard was tasked with synthesizing discussions on clustering approaches produced by the four working. They examined the "dashboard," "jigsaw puzzle" and "intersecting circles" charts produced by the working groups to illustrate approaches. The group concluded that the "dashboard" provides an adequate approach and noted more work needs to be done to overcome shortcomings such as its inability to track trends and provide early warning signals. |
|
David
Bell (York Center for Applied Sustainability, York University) facilitating
the final plenary during which some participants suggested developing
a single, super-aggregated SD indicator, noting its effectiveness as
a means to communicate with policymakers and the public. Participants
noted that the time needed to develop an imperfect but testable SDI
could range from two to three years and experience gained during this
period could serve to refine the index. Others suggested that, instead
of creating a single SDI, the primary objective should be to develop
a cluster of sub-indices to be aggregated in the future.
|
|
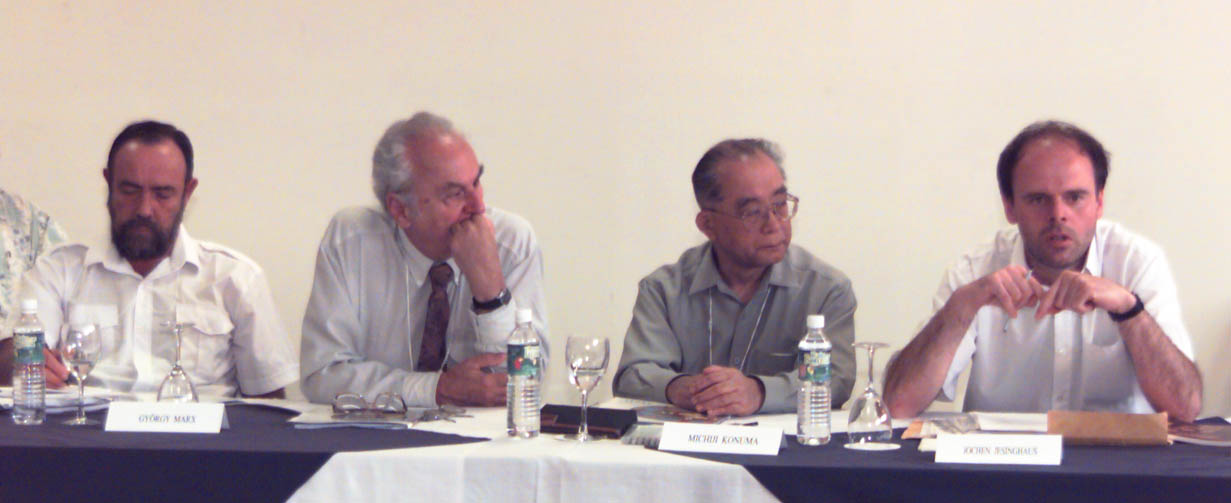 |
From left to right: Rowan Martin (independent consultant), Gyorgy Marx (Hungarian Physical Society), Michiji Konuma (Faculty of Environmental and Information Studies, Musashi Institute of Technology) and Jochen Jesinghaus (Institute for Systems, Informatics and Safety; EC). |
|
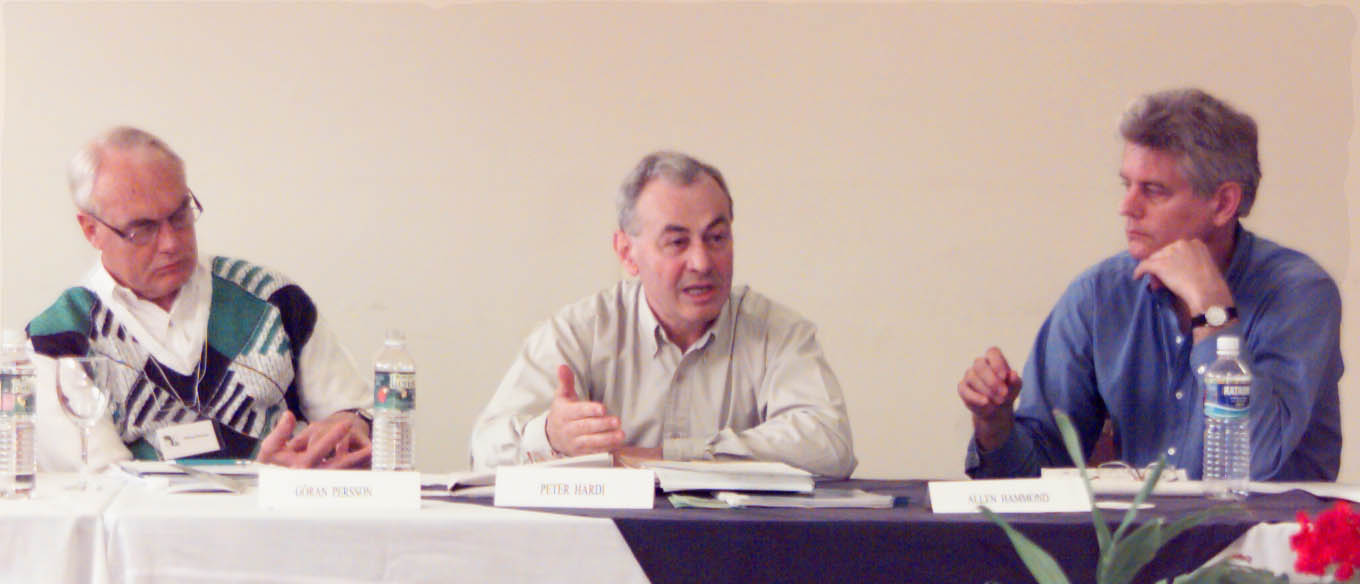
From
left to right: Goran Persson (Foundation for Strategic Environmental
Research - MISTRA, Sweden), Peter Hardi (Chair of the workshop and Director
of Measurement and Indicators Programme, IISD) and Allen Hammond (World
Resource Institute).
|
|
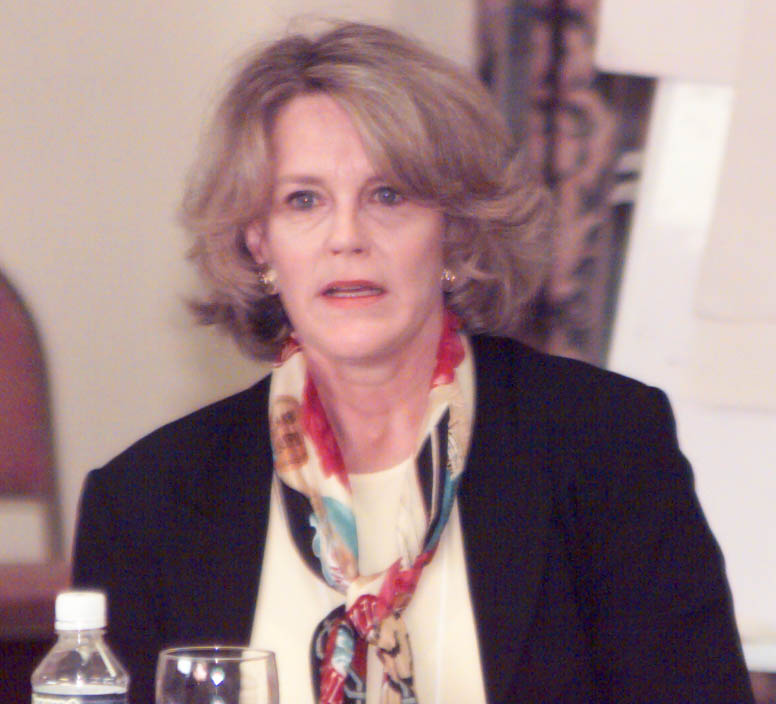 |
Barbara Pyle of the Environment Division of Turner Broadcasting Systems |
|
Bill
Glanville, Vice President IISD
|
|
|
Mr. AtKisson sang this original composition during the Closing Plenary to remind participants that solutions must be context-specific and that local adaptation is a function of local Involvement. |
|
Linkages
Home ![]() Sustainable
Developments home
Sustainable
Developments home
©
1999, SD / Earth Negotiations Bulletin. All
rights reserved.